Vasc-Alert User Documentation
Diving Deeper: the Patient Detail Report
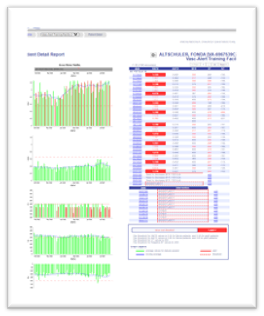 The Patient Detail report includes graphs with 6 months of VAPR and AAPR results, as well as session averages for blood flow rate, venous pressure, and negative arterial pressure. Above the VAPR graphic is the Access History Timeline. This identifies what access the patient is using and how many treatments have been performed on the access.
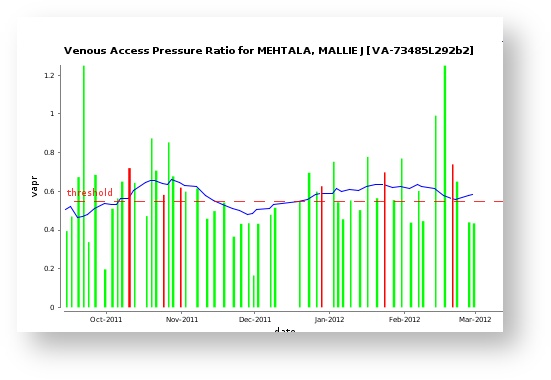
The session average for each dialysis session is shown as a vertical green bar. Dates with alerts are shown with vertical red bars. For help in trending, a moving average is displayed as a blue line on each graph. Threshold values appear as dotted red lines.
Results for the past 36 sessions appear in the Average Session Values table on the right side of the screen, with the latest treatments at the top of the table.
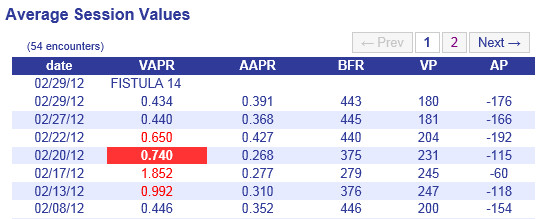
You can access older treatments by using the Navigation Buttons  .
.
© 2023